Sun-soaked property market offers opportunities aplenty
Stock levels hit an 8-year high as new listing levels bounce back to welcome buyers. Prices remained stable while Kiwis awaited the latest OCR announcement.
The end of summer has seen the New Zealand property market return to full health as Kiwis started back at school and work. The latest data from realestate.co.nz for February saw high stock levels nationally, thanks to more new listings refilling housing supply levels.
Nationally, prices rose gently in February, suggesting that while the market is starting to warm up, a more sustainable market is in play.
Kiwis have been waiting in the wings for news on the Official Cash Rate (OCR) in February, uncertain about whether the rate would come down, hold or increase. Wednesday’s announcement from the Reserve Bank holding the rate at 5.5% has provided some certainty for vendors and buyers.
Vanessa Williams, spokesperson for realestate.co.nz, remarks that as the country navigates ongoing economic challenges, it is refreshing to see the property market looking more stable:
“With no change to the OCR and gentle easing of interest rates by some of the larger retail banks, it will be interesting to see how these factors play out for the property market in the coming months.”
New listings bounce back to health
In February, 11,788 new listings came onto the market, marking a 44.8% increase nationally compared to last year. This influx is a return to health after new listings in February 2023 hit an all-time low for any February since realestate.co.nz records began in 2007.
New listings were up across all 19 regions, with the most significant increases observed in Northland (up 94.6%), Coromandel (up 85.3%), Wellington (up 76.6%), Hawke’s Bay (up 75.4%) and Auckland (up 64.0%).
Vanessa says that the bounce back in listings reveals a confident market, a much different market to the same time last year:
“Last February saw us dealing with a very different summer as Kiwis grappled with the effects of back-to-back weather events.
“In a typical February month, we would see around 11,000 new listings come onto the market. Seeing numbers back in the ‘normal’ range tells us that Kiwis are becoming more positive about listing their properties for sale. This is great news for buyers, offering them a wider array of options.”
High stock brings options aplenty for buyers
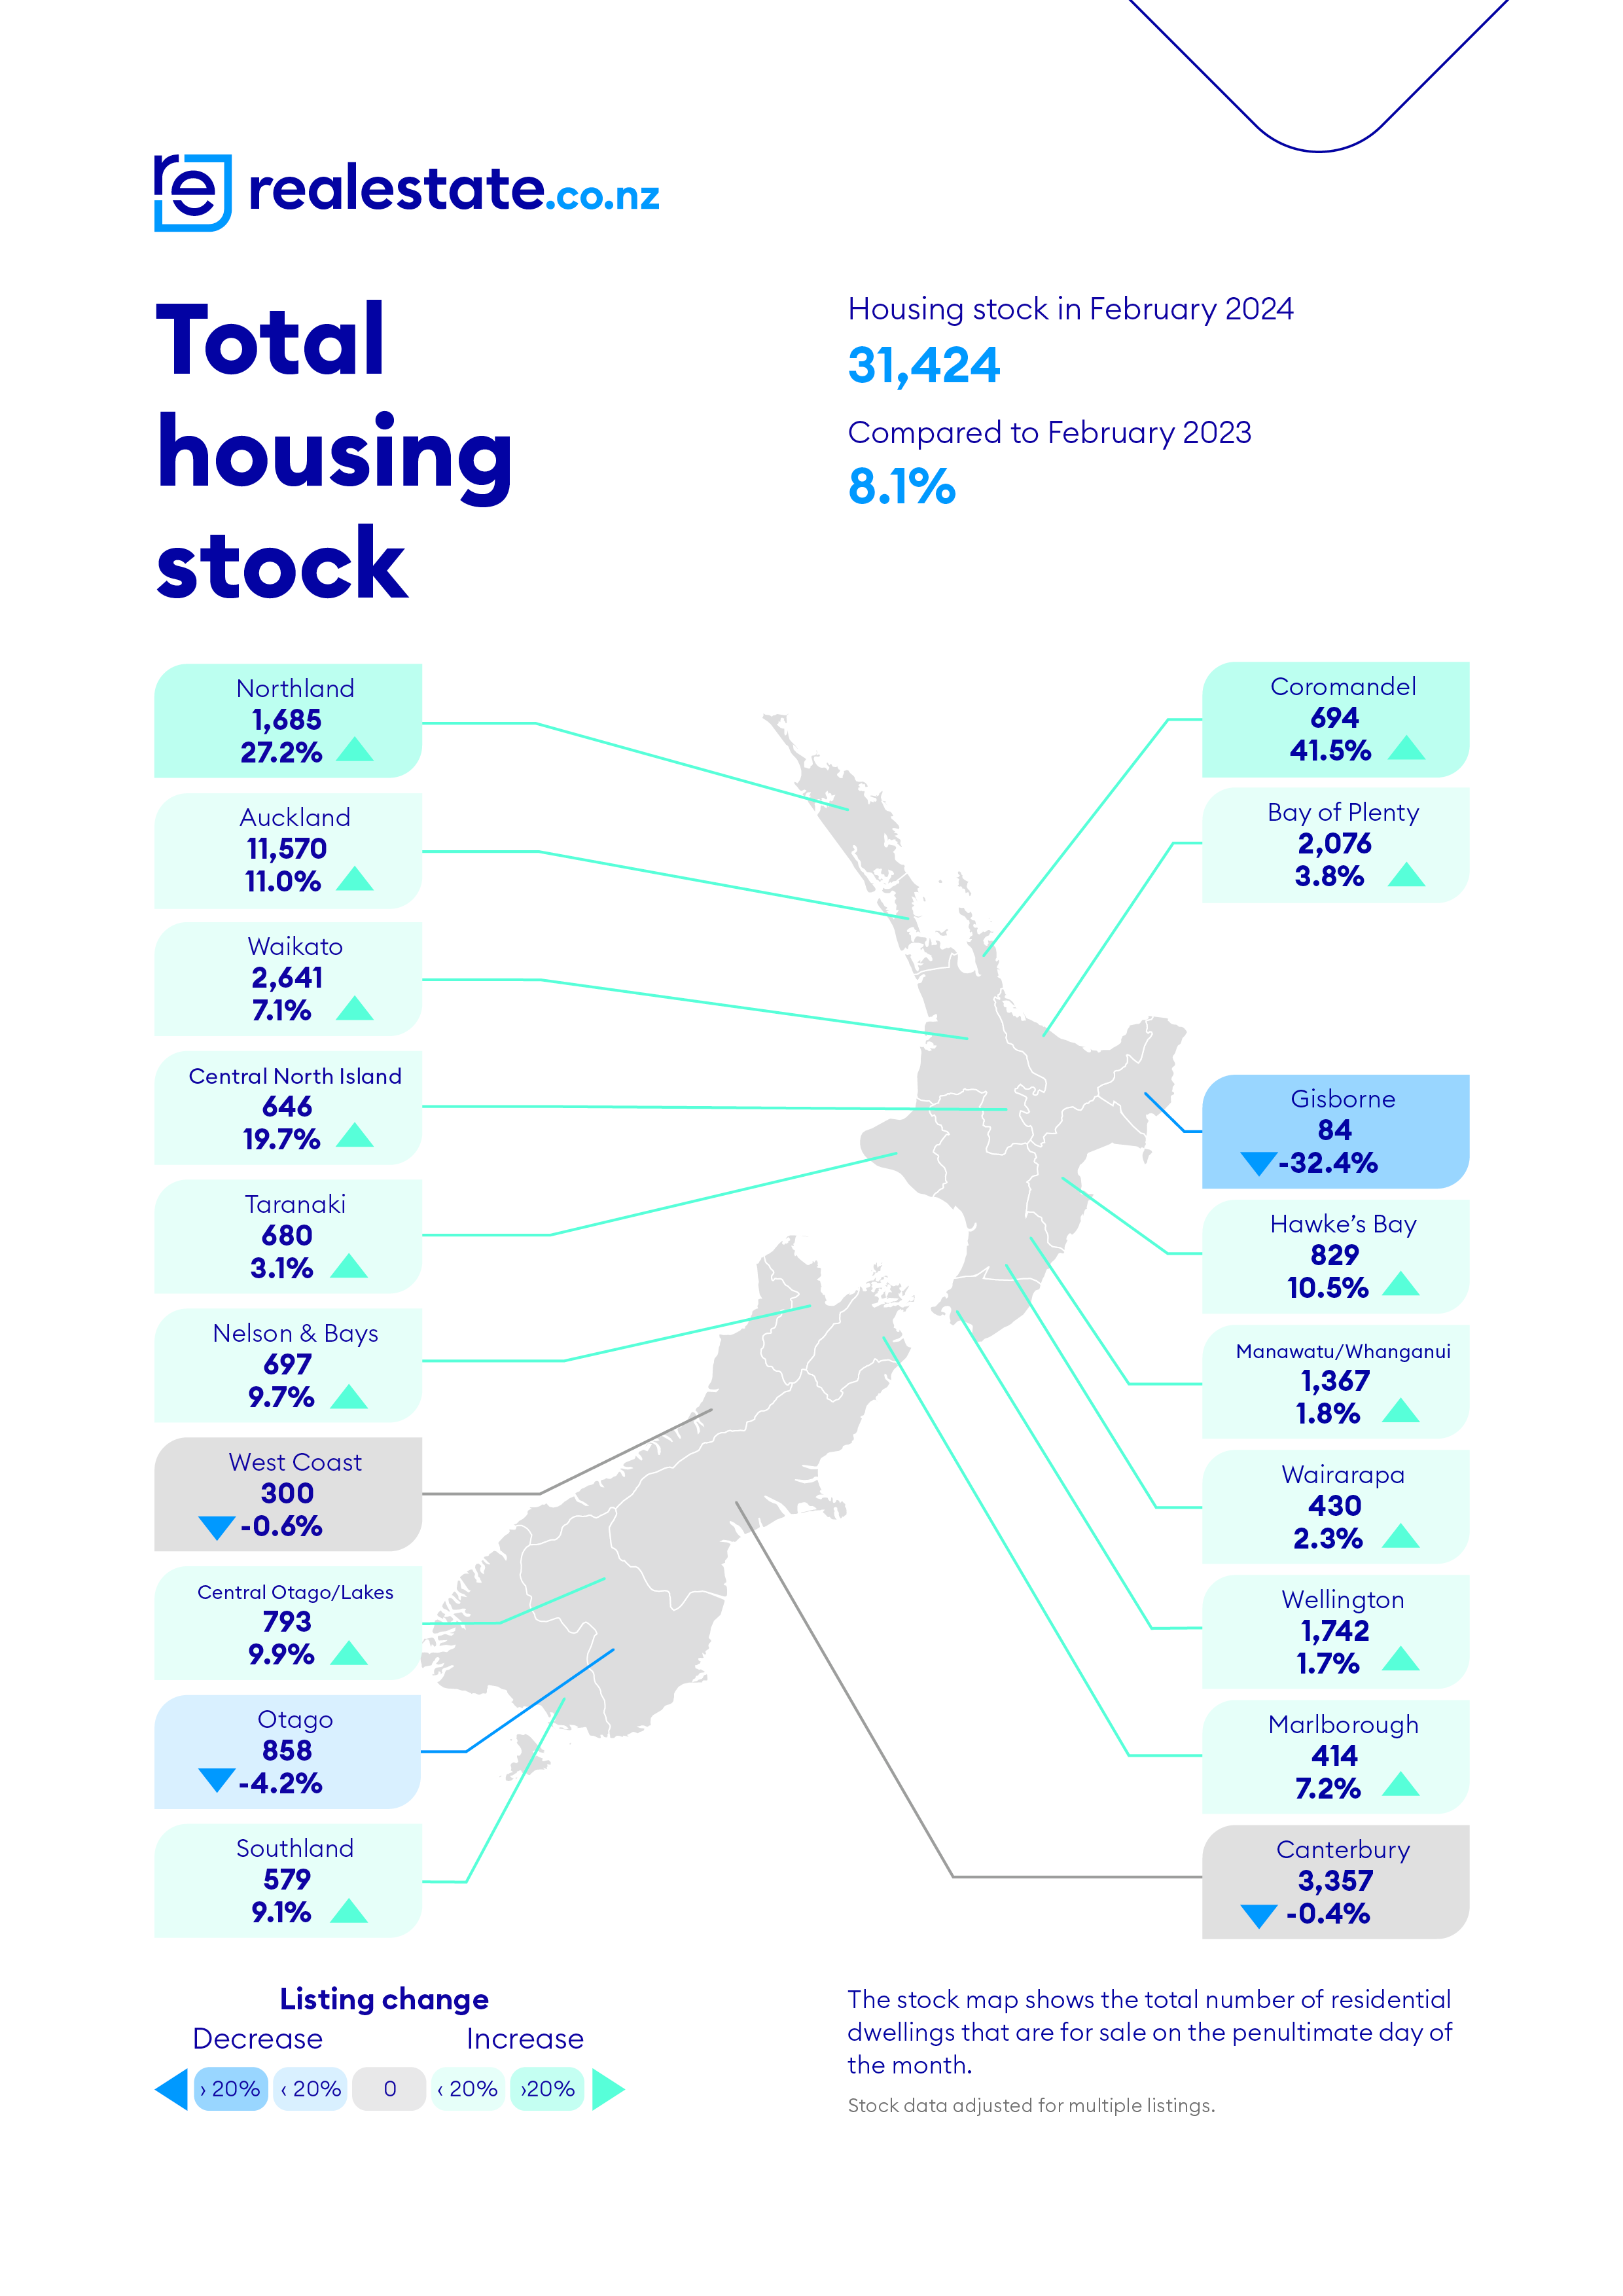
February saw the highest number of total properties on the market in almost a decade. Housing stock rose to 31,424 in February (an increase of 8.1% year on year); the last time supply reached over 30,000 was in November 2015.
Most regions contributed to the revival, with stock levels rising in all except two regions year-on-year, these were Gisborne (down 32.4%) and Otago (down 4.2%). Gisborne saw record-low stock levels for any February since records began 17 years ago.
Coromandel and Northland saw the largest increases in housing stock, with levels rising 41.5% and 27.2%, respectively.
Vanessa explains that the rise in stock levels not only gives buyers more opportunities but also more time to decide:
“We haven’t seen this level of opportunity for buyers in over eight years. The high number of people searching on our site shows that this increase in options is being met with interest.”
The number of people searching per listing on realestate.co.nz in February was up 10.1% compared to the same time last year. Engagement, which includes property saves and enquiries, was also up 22.6% nationally. Regions that saw the highest increase in engagements were Wellington (up 63.6%) and Wairarapa (up 53.5%).
Prices rise gently; Central Otago continues to break records
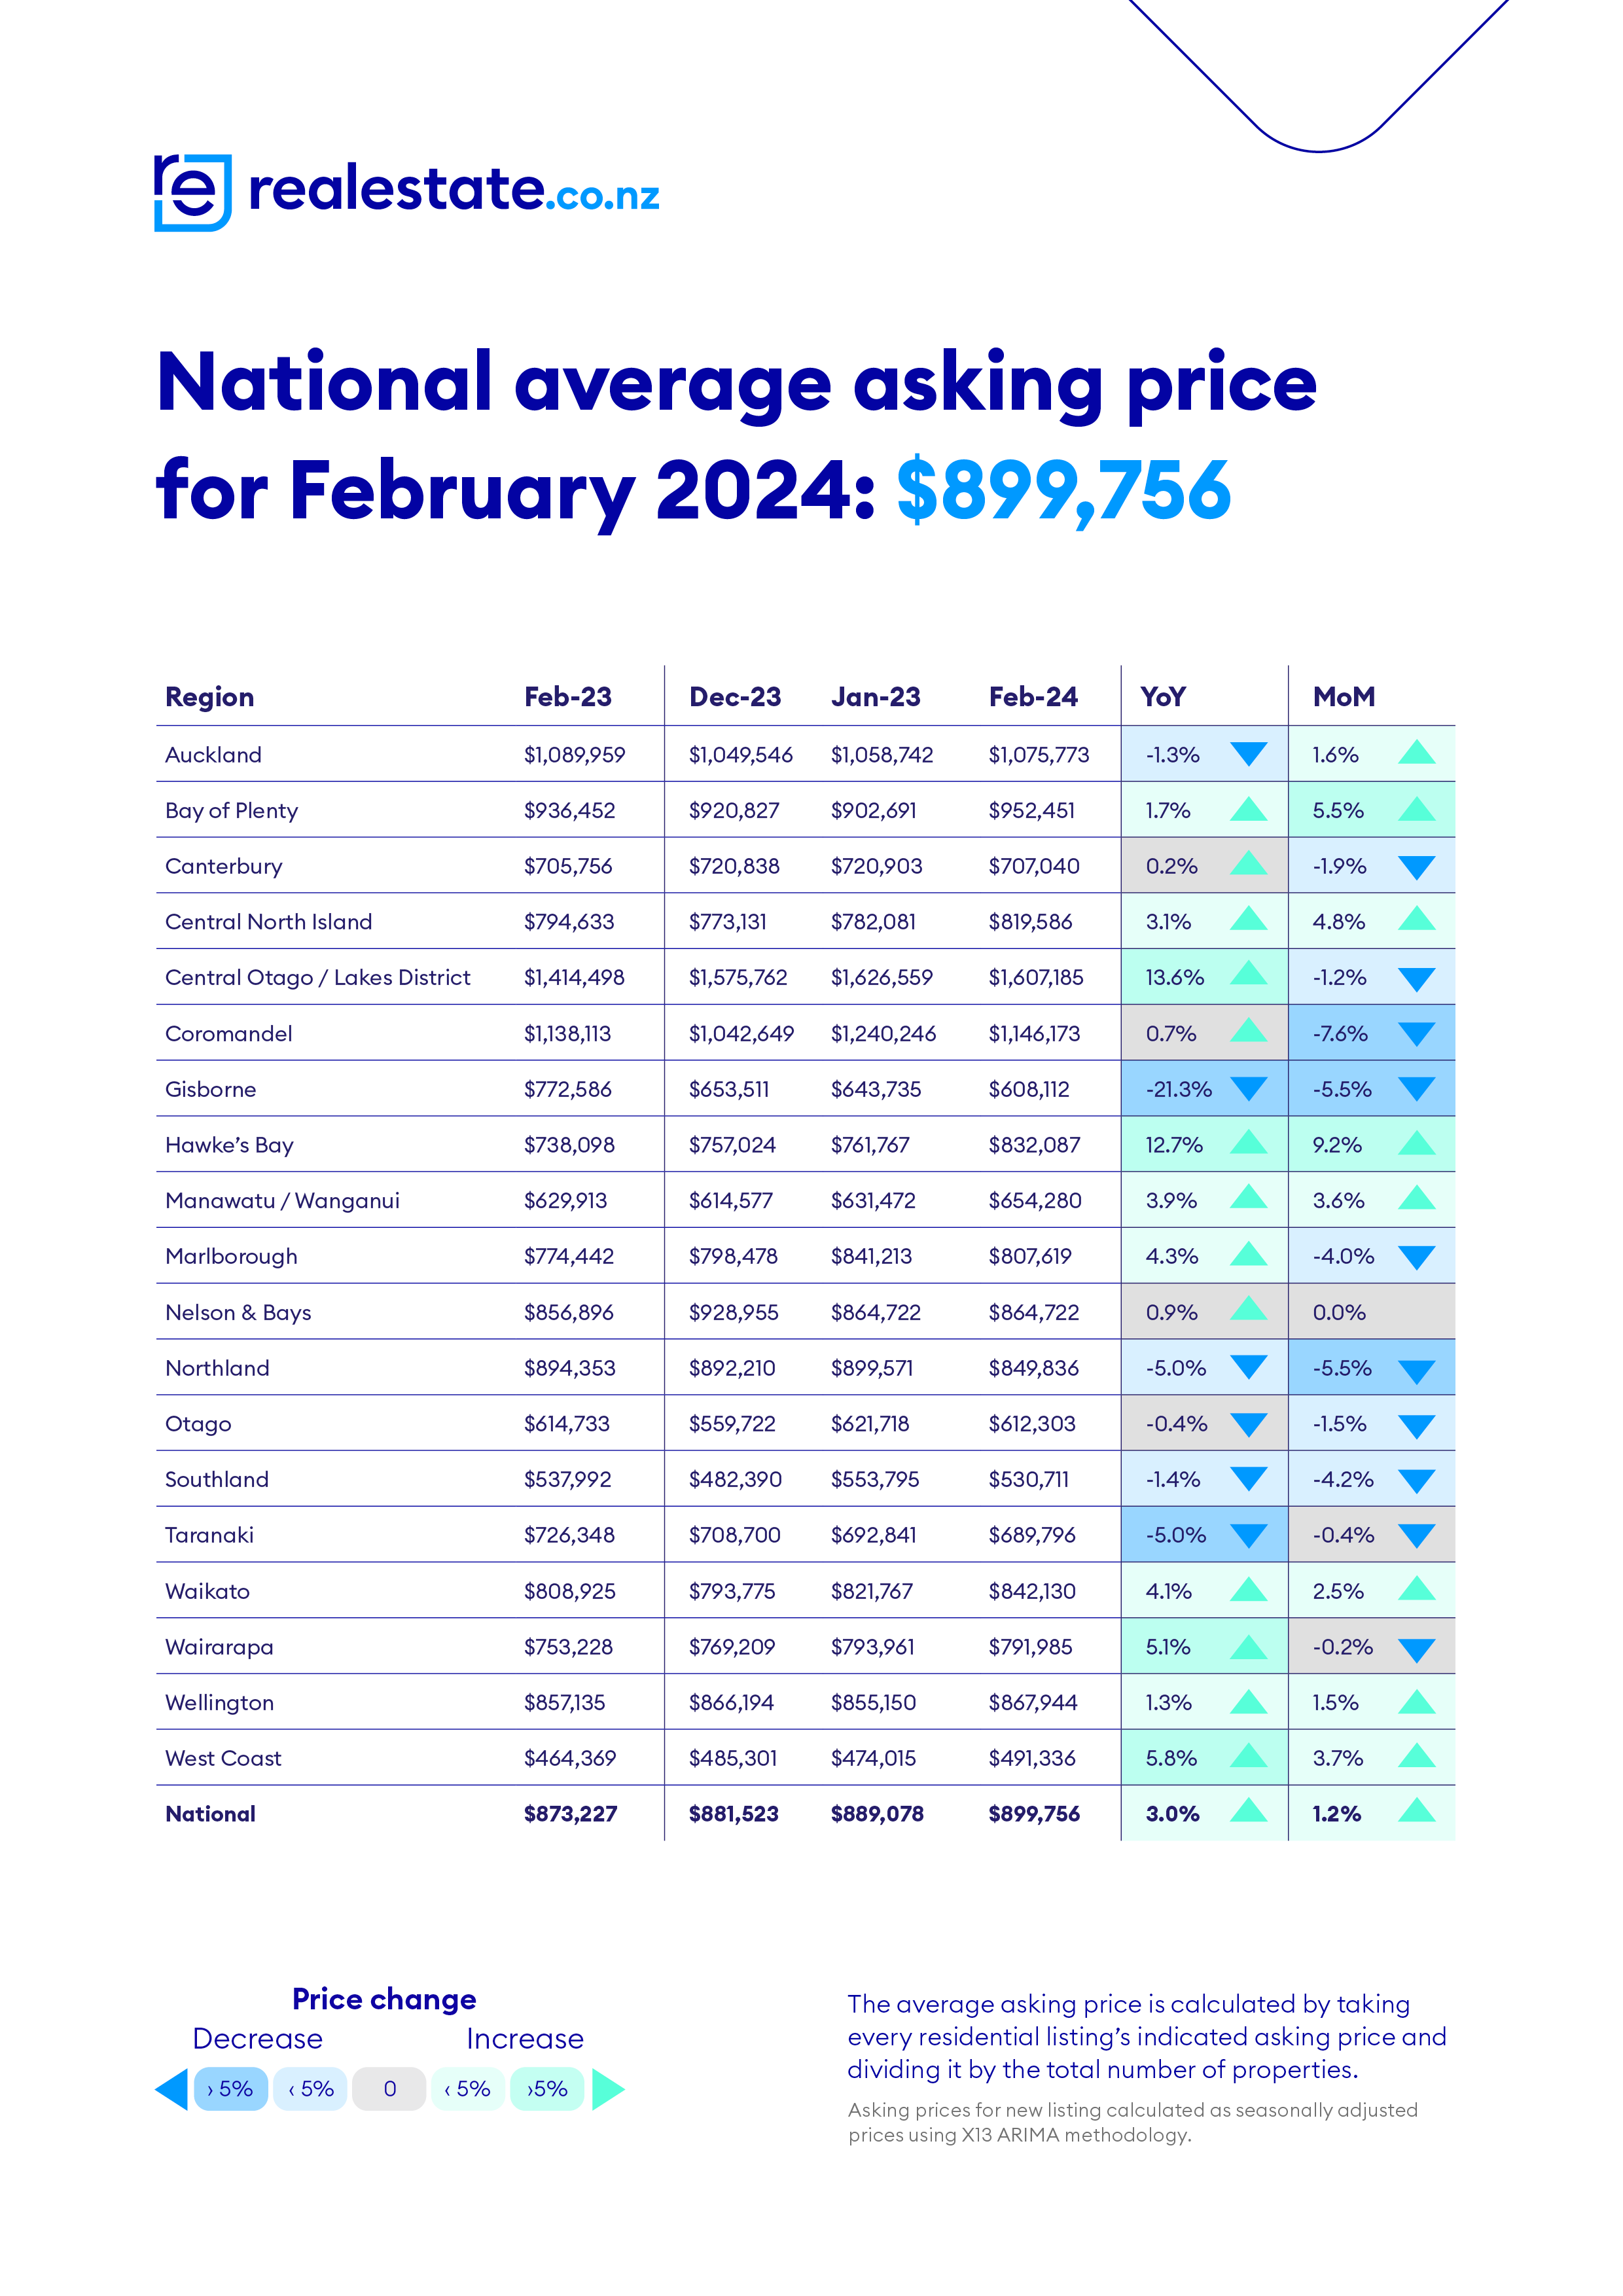
The national average asking price rose to $899,756, up 3.0% on the same time last year and 1.2% from January.
Another small lift to the average asking prices in February is an indicator of sustainable market health, says Vanessa:
“This slight increase in asking price, alongside an increase in properties coming to market, suggests buyers are being more considered with purchase time.”
Amid the relative stability across the country, several regions saw new records set. Marlborough, Wairarapa, Central Otago/ Lakes District, and the West Coast all experienced record-high average asking prices for any February since records began. After a challenging year, Hawke’s Bay saw asking prices return to above $800,000 for the first time since before the weather events in 2023.
The stand-out performer among our regions, Central Otago/ Lakes District, maintained an average asking price above $1.6 million in February after reaching an all-time national high in January.
“After the highs and lows of the past few years, we are now seeing signs across the board that the property market is recovering, which is good news for those looking to buy or sell across the motu,” Vanessa adds.
For media enquiries, please contact:
Brigid Conroy | brigid@brainchild.co.nz| Brainchild
About realestate.co.nz
We’ve been helping people buy, sell, or rent property since 1996.
Established before Google, realestate.co.nz is New Zealand’s longest-standing property website and the official website of the real estate industry.
Dedicated only to property, our mission is to empower people with a property search tool they can use to find the life they want to live. With residential, lifestyle, rural and commercial property listings, realestate.co.nz is the place to start for those looking to buy or sell property.
Whatever life you’re searching for, it all starts here.
Want more property insights?
- Market insights: Search by suburb to see median sale prices, popular property types and trends over time.
- Sold properties: Switch your search to sold to see the last 12 months of sales and prices.
- Valuations: Get a gauge on property prices by browsing sold residential properties, with the latest sale prices and an estimated value in the current market.
Glossary of terms:
Average asking price (AAP) is neither a valuation nor the sale price. It is an indication of current market sentiment. Statistically, asking prices tend to correlate closely with the sales prices recorded in future months when those properties are sold. As it looks at different data, average asking prices may differ from recorded sales data released simultaneously.
New listings are a record of all the new residential dwellings listed for sale on realestate.co.nz for the relevant calendar month. The site reflects 97% of all properties listed through licensed real estate agents and major developers in New Zealand. This description gives a representative view of the New Zealand property market.
Stock is the total number of residential dwellings that are for sale on realestate.co.nz on the penultimate day of the month.
Inventory is a measure of how long it would take, theoretically, to sell the current stock at current average rates of sale if no new properties were to be listed for sale. It provides a measure of the rate of turnover in the market.
Demand measures the level of serious buyer interest compared to the available supply. It does this by tracking two related datasets – searches and engagements per listing. Searches per listing divides the total number of searches on realestate.co.nz by stock. Engagements per listing divides the total number of enquiries and property saves by stock.
Seasonal adjustment is a method realestate.co.nz uses to represent better the core underlying trend of the property market in New Zealand. This is done using methodology from the New Zealand Institute of Economic Research.
Truncated mean is the method realestate.co.nz uses to supply statistically relevant asking prices. The top and bottom 10% of listings in each area are removed before the average is calculated to prevent exceptional listings from providing false impressions.


